http://blogs.msdn.com/b/cenkiscan/archive/2011/01/17/log-parser-214-rnek-komutlar.aspx
IIS W3C Extended Logging Field Definitions
|
Field |
Appears As | Description |
|---|---|---|
| Date | date | The date that the activity occurred. |
| Time | time | The time that the activity occurred. |
| Client IP Address | c-ip | The IP address of the client that accessed your server. |
| User Name | cs-username | The name of the authenticated user who accessed your server. This does not include anonymous users, who are represented by a hyphen (-). |
| Service Name | s-sitename | The Internet service and instance number that was accessed by a client. |
| Server Name | s-computername | The name of the server on which the log entry was generated. |
| Server IP Address | s-ip | The IP address of the server on which the log entry was generated. |
| Server Port | s-port | The port number the client is connected to. |
| Method | cs-method | The action the client was trying to perform (for example, a GET method). |
| URI Stem | cs-uri-stem | The resource accessed; for example, Default.htm. |
| URI Query | cs-uri-query | The query, if any, the client was trying to perform. |
| Protocol Status | sc-status | The status of the action, in HTTP or FTP terms. |
| Win32® Status | sc-win32-status | The status of the action, in terms used by Microsoft Windows®. |
| Bytes Sent | sc-bytes | The number of bytes sent by the server. |
| Bytes Received | cs-bytes | The number of bytes received by the server. |
| Time Taken | time-taken | The duration of time, in milliseconds, that the action consumed. |
| Protocol Version | cs-version | The protocol (HTTP, FTP) version used by the client. For HTTP this will be either HTTP 1.0 or HTTP 1.1. |
| Host | cs-host | Displays the content of the host header. |
| User Agent | cs(User-Agent) | The browser used on the client. |
| Cookie | cs(Cookie) | The content of the cookie sent or received, if any. |
| Referrer | cs(Referer) | The previous site visited by the user. This site provided a link to the current site. |
| Prefix | Meaning |
|---|---|
|
s-
|
Server actions.
|
|
c-
|
Client actions.
|
|
cs-
|
Client-to-server actions.
|
|
sc-
|
Server-to-client actions.
|
Log Parser Lizard
Özellikle IIS Loglarını analiz edebileceğiniz şahane bir araç. Log Parser Lizard
Öncelikle Log Parser 2.2 ı indiriyoruz. Log Parser 2.2 Klasik kurulum sonrasında
C:\Program Files (x86)\Log Parser 2.2>regsvr32 LogParser.dll komutu ile LogParser.dll i alıyoruz.
Log Parser Lizard http://www.lizard-labs.com/log_parser_lizard.aspx uygulamasını kuruyoruz. Almış olduğumuz IIS .log ve httperr loğlarını uygulama üzerinden açarak çalışmaya başlayabiliyoruz.
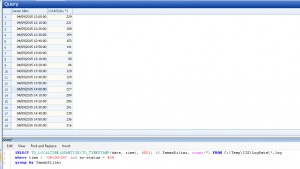
Örnek 1: 10 ar dakikalık ara ile alınan 404 hatalarının sayısı.
SELECT TO_LOCALTIME(QUANTIZE(TO_TIMESTAMP(date, time), 600)) AS ZamanDilimi, count(*) FROM C:\Temp\IIS\LogData\*.log where time > ’09:00:00′ and sc-status = 404 group by ZamanDilimi
Örnek 2: Log dosyasındaki başlıkları görüntüleme
select TOP 1 * FROM C:\Temp\IIS\LogData\*.log
Örnek 3: Alınan hata kodlarına göre guruplama. Kaç tane 404, 500 hatası alınmış gibi. 200 başarılı işlemlerdir.
SELECT sc–status, count(*) FROM C:\Temp\IIS\LogData\*.log group by sc–status
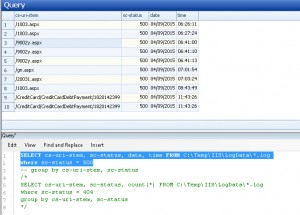
Örnek 4: Hangi sayfalarda 500 hatası alınmış.
SELECT cs–uri–stem, sc–status, date, time FROM C:\Temp\IIS\LogData\*.log where sc–status = 500
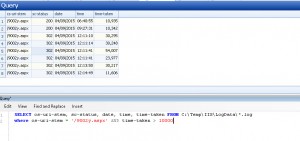
Örnek 5: Belirtilen sayfadaki 10 sn den uzun süren hatalar.
SELECT cs–uri–stem, sc–status, date, time, time–taken FROM C:\Temp\IIS\LogData\*.log where cs–uri–stem = ‘/9002y.aspx’ AND time–taken > 10000
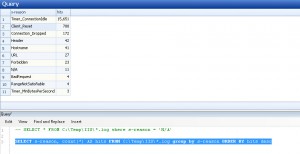
Örnek 6: Alınan hata nedenlerinin sayılarının adetsel durumu
SELECT s–reason, count(*) AS hits FROM C:\Temp\IIS\*.log group by s–reason ORDER BY hits desc
IIS Error logging in HTTP APIs
%SystemRoot%\System32\LogFiles dizininden HTTPERR loğlarına erişebiliriz. Geniş bilgi: https://support.microsoft.com/en-us/kb/820729
Bazı Mesajlar ve Anlamları:
| Reason Phrase | Description |
| AppOffline | A service unavailable error occurred (an HTTP error 503). The service is not available because application errors caused the application to be taken offline. |
| AppPoolTimer | A service unavailable error occurred (an HTTP error 503). The service is not available because the application pool process is too busy to handle the request. |
| AppShutdown | A service unavailable error occurred (an HTTP error 503). The service is not available because the application shut down automatically in response to administrator policy. |
| BadRequest | A parse error occurred while processing a request. |
| Client_Reset | The connection between the client and the server was closed before the request could be assigned to a worker process. The most common cause of this behavior is that the client prematurely closes its connection to the server. |
| Connection_Abandoned_By_AppPool | A worker process from the application pool has quit unexpectedly or orphaned a pending request by closing its handle. |
| Connection_Abandoned_By_ReqQueue | A worker process from the application pool has quit unexpectedly or orphaned a pending request by closing its handle. Specific to Windows Vista and later versions and to Windows Server 2008 and later versions. |
| Connection_Dropped | The connection between the client and the server was closed before the server could send its final response packet. The most common cause of this behavior is that the client prematurely closes its connection to the server. |
| Connection_Dropped_List_Full | The list of dropped connections between clients and the server is full. Specific to Windows Vista and later versions and to Windows Server 2008 and later versions. |
| ConnLimit | A service unavailable error occurred (an HTTP error 503). The service is not available because the site level connection limit has been reached or exceeded. |
| Connections_Refused | The kernel NonPagedPool memory has dropped below 20MB and http.sys has stopped receiving new connections |
| Disabled | A service unavailable error occurred (an HTTP error 503). The service is not available because an administrator has taken the application offline. |
| EntityTooLarge | An entity exceeded the maximum size that is permitted. |
| FieldLength | A field length limit was exceeded. |
| Forbidden | A forbidden element or sequence was encountered while parsing. |
| Header | A parse error occurred in a header. |
| Hostname | A parse error occurred while processing a Hostname. |
| Internal | An internal server error occurred (an HTTP error 500). |
| Invalid_CR/LF | An illegal carriage return or line feed occurred. |
| LengthRequired | A required length value was missing. |
| N/A | A service unavailable error occurred (an HTTP error 503). The service is not available because an internal error (such as a memory allocation failure or URL Reservation List conflict) occurred. |
| N/I | A not-implemented error occurred (an HTTP error 501), or a service unavailable error occurred (an HTTP error 503) because of an unknown transfer encoding. |
| Number | A parse error occurred while processing a number. |
| Precondition | A required precondition was missing. |
| QueueFull | A service unavailable error occurred (an HTTP error 503). The service is not available because the application request queue is full. |
| RequestLength | A request length limit was exceeded. |
| Timer_AppPool | The connection expired because a request waited too long in an application pool queue for a server application to de-queue and process it. This time-out duration is ConnectionTimeout. By default, this value is set to two minutes. |
| Timer_ConnectionIdle | The connection expired and remains idle. The default ConnectionTimeout duration is two minutes. |
| Timer_EntityBody | The connection expired before the request entity body arrived. When a request clearly has an entity body, the HTTP API turns on the Timer_EntityBody timer. At first, the limit of this timer is set to the ConnectionTimeout value (typically, two minutes). Every time that another data indication is received on this request, the HTTP API resets the timer to give the connection two more minutes (or whatever is specified in ConnectionTimeout). |
| Timer_HeaderWait | The connection expired because the header parsing for a request took more time than the default limit of two minutes. |
| Timer_MinBytesPerSecond | The connection expired because the client was not receiving a response at a reasonable speed. The response send rate was slower than the default of 240 bytes/sec. This can be controlled with the MinFileBytesPerSec metabase property. |
| Timer_ReqQueue | The connection expired because a request waited too long in an application pool queue for a server application to de-queue. This time-out duration is ConnectionTimeout. By default, this value is set to two minutes. Specific to Windows Vista and later versions and to Windows Server 2008 and later versions. |
| Timer_Response | Reserved. Currently not used. |
| Timer_SslRenegotiation | The connection expired because SSL renegotiation between the client and server took longer than the default time-out of two minutes. |
| URL | A parse error occurred while processing a URL. |
| URL_Length | A URL exceeded the maximum permitted size. |
| Verb | A parse error occurred while processing a verb. |
| Version_N/S | A version-not-supported error occurred (an HTTP error 505). |
Çevik Yaklaşım Nam-ı Diğer Agile
http://www.cevikstudyo.com arkadaşlarımızın kurduğu bir site, agile yaklaşımlara dair birçok şey bulabilirsiniz. Damdan düşenlerin sitesi 🙂
Excel Transpose Yapıştırma
Troubleshooting Failed Requests Using Tracing in IIS 7
IIS ‘ de problem çözümleri için güzel bir makale.
30 Haziran 23:59 saatlerimizi 1 sn geri alıyoruz
Microsoft sorun olmayacağını iletiyor. http://blogs.msdn.com/b/mthree/archive/2015/01/08/leap-seconds-010815.aspx
Use the Page File Bytes Peak counter to calculate page file size
Use the Page File Bytes Peak counter to calculate page file size
- Click Start, point to Administrative Tools, and then click Performance Monitor.
- Expand Data Collector Sets, right-click User Defined, click New, and then click Data Collector Set.
- In the Name box, type a name for the log, and then click OK.
- Select the Create manually (advanced)option, and then click Next.
- Select the Create data logsoption, click to select the Performance counter check box, and then click Next.
- Under Which performance counters would you like to log?, click Add.
- Under Select counters from computer, make sure that <Local computer>
- In the Performance object list, click Process, and then click Page File Bytes Peak.
- Under Instances of selected object, select Total, click Add>>, and then click OK.
- Under Sample interval, select the interval that you want. (The default is 15 seconds.)
- Click Next two times.
- Click Finish.
- Let the counter run during typical use of your computer.
Note the maximum value for the Page File Bytes Peak counter, and then multiply the value by 0.70. The sum of the equation is the size to set for your page file.
Performance Tuning Guidelines for previous versions of Windows Server
Windows Server 2012 R2 için Performance Tuning Guidelines a buradan ulaşabilirsiniz.
Windows Server 2012 için Performance Tuning Guidelines a buradan ulaşabilirsiniz.
Windows Server 2008 R2 için Performance Tuning Guidelines a buradan ulaşabilirsiniz.
Windows Server 2008 için buradan ulaşabilirsiniz.


